

LTV Measurement - The Lord of the ROIngs, Part I: The Fellowship of the Discounted Cash Flow
LTV Measurement - The Lord of the ROIngs, Part I: The Fellowship of the Discounted Cash Flow

In my previous article, I promised no fewer than five methods for calculating and forecasting customer lifetime value. I had planned to cover all five in a single article, but while reading the first draft it dawned on me that this was too much calculation for any reasonable person to want to read about in a single sitting, so I decided to split that article into three shorter ones, each dealing with one or two implementations of LTV measurement or forecasting.
This is the first of those three articles, where I begin with the LTV calculation found in virtually every "How to Calculate LTV" article on the internet. The Textbook Method (as I'm calling it) for calculating LTV is not a sophisticated forecasting method, but rather a simple way of using current retention and monetisation data to calculate the overall LTV of your existing customer base.
One Formula to rule them all, One Formula to find them, One Formula to bring them all, and in a spreadsheet bind them

Average Gross Profit per Active User: The average monthly revenue per active customer minus the average direct costs per active user.
Monthly Churn Rate: The percentage of active users who unsubscribed or stopped using the product in the month. I normally calculate churn on a net basis, subtracting reactivated customers (those who had previously churned but have returned) from churned customers.
Dividing by the monthly churn rate is equivalent to multiplying by the average customer lifetime in months. If your monthly churn rate is 5%, that means your customer base churns out after 20 months on average (1 / 5% = 20), so dividing a GP per user of £2 by a churn rate of 5% will give you the same answer as multiplying by a lifetime of 20 months.
The formula above is how subscription businesses usually calculate LTV (albeit with Gross Profit often dubiously swapped out for Revenue), and the formula for other types of business may be written slightly differently, but it's generally just a variation on the same formula. For instance, a transactional e-commerce business would likely calculate LTV as:
LTV = Average Purchase Value * Average Purchase Frequency * Average Customer Lifetime * % Gross Margin
Both formulae contain the same information (Average Purchase Value * Average Purchase Frequency * % Gross Margin is the same thing as Gross Profit per Active User, and multiplying by Average Customer Lifetime is the same thing as dividing by Churn Rate), but the first happens to be more sensible in the subscription context, and the second more sensible in the e-commerce context.
If I were to force a Lord of the Rings analogy here, it would be the theory put forward in this article, that Tom Bombadil and the Witch-king of Angmar are one and the same. Just as the leader of the Nazgûl poses as a jolly forest-dwelling oddball, the Churn Rate of a SaaS business is the Average Customer Lifetime in fancy dress.
One does not simply divide by a single churn rate
As popular as it is, this method has its flaws. Firstly, it tells you nothing about churn behaviour at different stages of the customer lifecycle (6/12/24 months, etc.), and abstracts away any detail about changes in customer value over time. The latter won't matter for the simplest of SaaS models (i.e. single-tier, flat monthly fee), but can be limiting for transactional businesses, or SaaS businesses with either multiple pricing tiers or B2B pricing based on the number of users. A simple Average Gross Profit per User / Churn Rate doesn't cut it if you want to see how customer value progresses with customer maturity.
Another issue is that it gets skewed by the maturity of the business. Churn graphs almost always follow an L-shaped curve, which means that an ever-decreasing proportion of customers who are still active will churn each month. This stands to reason, as a customer who remains active for longer has already demonstrated a certain level of stickiness, so a 24-month-active user is inherently unlikely to churn. Compare this to a new customer, who will on average have a much higher risk of churn given they are still evaluating whether the product is right for them. If you launched your product within the last few months, your entire customer base is made up of new customers, which means that if you calculate your LTV by dividing by your current churn rate, the output may be unduly pessimistic.

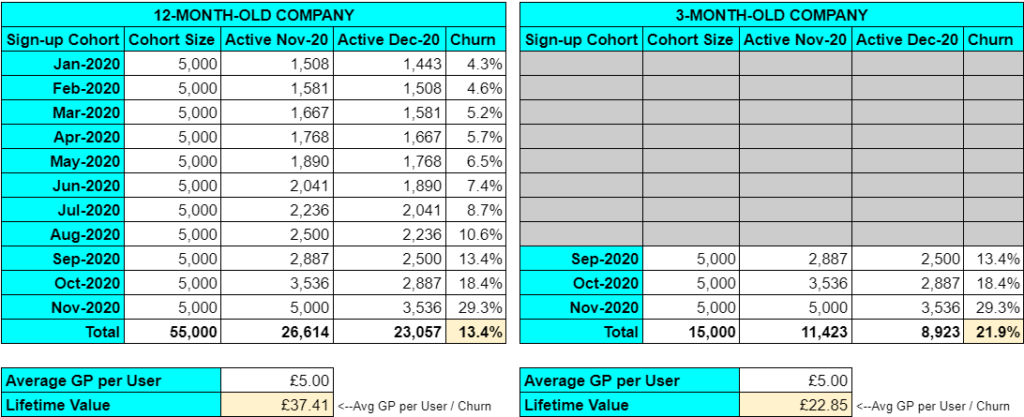
Over time, all else being equal, the average monthly churn rate across your customer base should decrease, as the the gradual increase in the average "age" (time since first purchase) of your customer base suppresses the average churn risk across your customer base. The example above shows how the activity curve for a given cohort of customers might look, where the relative change in the customer activity rate from month to month (i.e. the churn rate) gets smaller each month. This means that two identical businesses could report different LTVs simply because one launched several months later than the other.
In the example below, both companies acquire the same number of customers per month, experience the same churn behaviour, have the same unit economics, and use the same LTV calculation. They are the same in every way, but their overall churn rates (and therefore LTV) vary because the overall churn rate of the 3-month-old company is more heavily skewed towards new (high-churn) customers than that of the 12-month-old company.
In most cases, these flaws don't render the Textbook Method useless, and it's probably more common for a startup to see monthly user acquisition numbers grow over time, which would offset the churn skew problem above. It is usually the best choice for a business that simply wants to be able to report a headline LTV figure on a company dashboard. It's not perfect, but is broadly accurate, easy to calculate, and easy to understand. If your goal is primarily to have colleagues care about and understand the importance of LTV, you most likely don't need fine-grained accuracy, and there's no reason to complicate things.
I wouldn't usually recommend the Textbook Method as the best approach for Marketing teams to assess the ROI of on-going/recent campaigns, as it relies on the assumption that the LTV of the existing customer base is representative of the LTV of newly-acquired customers. In this case, one of the forecasting methods I'll come to in a later article may be more useful. That said, if you don't have access to anything better, and there aren't any obvious reasons to expect significant differences in LTV between customer cohorts, it's generally fine to use this method to set a benchmark against which to assess your CAC.
Likewise, for a pre-revenue business with no live customer data to work with, it would make sense to calculate an expected LTV figure based on assumed values for Gross Profit and Churn, and to use that as a stake in the ground against which to compare CAC.
It is a strange fate that we should expend such capital to generate future cash flow… such uncertain cash flow
The most Finance-savvy and MBA-endowed of my readership won't have made it this far, the reason being that they suffered a massive communal stroke when I proposed a method for calculating LTV without saying anything about discounted cash flow.
Especially for businesses with long customer lifecycles, it's important to remember that money tomorrow is worth less than money today. If much of the financial value of a customer won't be unlocked until several years in the future, the LTV figure should be adjusted for the present value of future cash flow. To some extent, this accounts for the opportunity cost of investing in acquiring a new customer rather than investing that same capital in a high-yield bond, but there is also an element of market risk to bear in mind, and even in today's world of low interest rates, discounted cash flows remain relevant.
The shape of our forecasted LTV curve represents what should happen if the market continues to look like it does today, which is unlikely if the forecast spans more than a couple of years. New competitors may emerge; new technology may disrupt the market; those microchips that Bill Gates apparently wants to inject into our arms for some reason might trigger a dystopian future in which nobody buys anything except Windows phones. Basically, we don't know what might happen in the future, and we should apply a discount not just to account for the lower present value of future cash flow, but also to account for the risk that this future cash flow may not materialise. The sources I've come across recommend an annual discount rate of at least 8%, with the most common rate seeming to be 10%.
There are some who recommend much higher discount rates (e.g. 20-25%) for early-stage, pre-scale businesses given the higher degree of uncertainty around their future. While this is a reasonable argument to make, I tend to agree with David Skok that, if startups (and their investors) are to compare their unit economics against incumbents, using vastly different discount rates for startups vs. public companies can set an unreasonable benchmark. Setting too high a discount rate could also stymie healthy growth, given that the resulting deflated LTV:CAC ratio may prompt a business to spend less on customer acquisition than it ideally should. More context on the LTV:CAC ratio here.
To give an example of discount rates in action, we could factor a 10% discount into our calculation by adding the discount rate to the churn rate before performing the division. If we're using monthly data in our calculation, we need to convert that 10% annual discount to its monthly equivalent. It might seem obvious here to just divide the annual rate by 12, but that's not quite right, as it doesn't factor the compounding effect into the monthly rate.
The correct formula is dm = (1 + da)1/12 - 1, where dm is the monthly discount rate and da is the annual discount rate. From an annual discount of 10%, this gives us a monthly discount of 0.797%, and our adjusted LTV formula becomes:
LTV = Average Gross Profit Per Active User / (Monthly Churn Rate + (1 + Discount Rate)1/12 - 1)

Without the discount rate, we calculate an LTV of £40. With the discount rate, it becomes £34.50. The longer the customer lifetime, the greater the relative impact of the discount. For example, if our churn rate were halved to 2.5% (giving a lifetime of 40 months), our LTV would go from £80 without the discount rate to £60.65 with the discount rate. Without the discount, halving churn doubles LTV; with the discount, the proportional increase is smaller (76%) because of the progressively lower weighting of value created further in the future.
Some people don't bother with discount rates, and that's often fine. For historical LTV calculations, where you measure the value already generated, there is no need to discount anything given you already have the money and you have no need to account for any uncertainty. Discounting is only necessary when you are looking to calculate the future value of a group of customers.
Likewise, for high-churn B2C business with an average customer lifetime of a year or two, a 10% discount rate often does not make a dramatic difference, and most reasonable people will forgive you for omitting it. Things become more problematic for business with longer customer lifecycles, such as B2B infrastructure providers, where omitting the discount rate can result in wildly overestimated LTV and ROI.
To close with another forced analogy, dragged from the depths of Tolkien lore, it is probable that Sauron - the eponymous Lord of the Rings - did not apply a discount rate when he forged the Rings of Power.
When pitching for seed funding for his venture, he lured investors with the promise of a stake in eternal dominion over all the races of Middle-earth. A seat in the boardroom of Barad-dûr. Preferred shares in Mordor Technology Ltd, the hottest TyrannyTech startup since Facebook.
What the Dark Lord neglected to mention in his pitch deck was that his organisation faced multiple threats - high employee turnover, legal costs and compensation payouts due to frequent death-in-service; an active volcano, next to the company's head office, liable to explode on contact with small items of jewellery. That's just to name a couple. In projecting a future of everlasting, unassailable monopoly, he made the mistaken assumption that power tomorrow is worth the same as power today, and ignored the possibility that this power might be disrupted by external forces in the future. Consequently, his investors got burned, along with poor Sméagol who only ever wanted to be held, understood, and told that he mattered.
https://hotcrossjoin.com/lifetime-value-two-regressions/