I mostly write (or plan to) about Data orgs, technology, metrics, and some miscellaneous work-related stuff, and publish a new post every few weeks. If you want to read more of my work, please subscribe below. Thanks for reading!
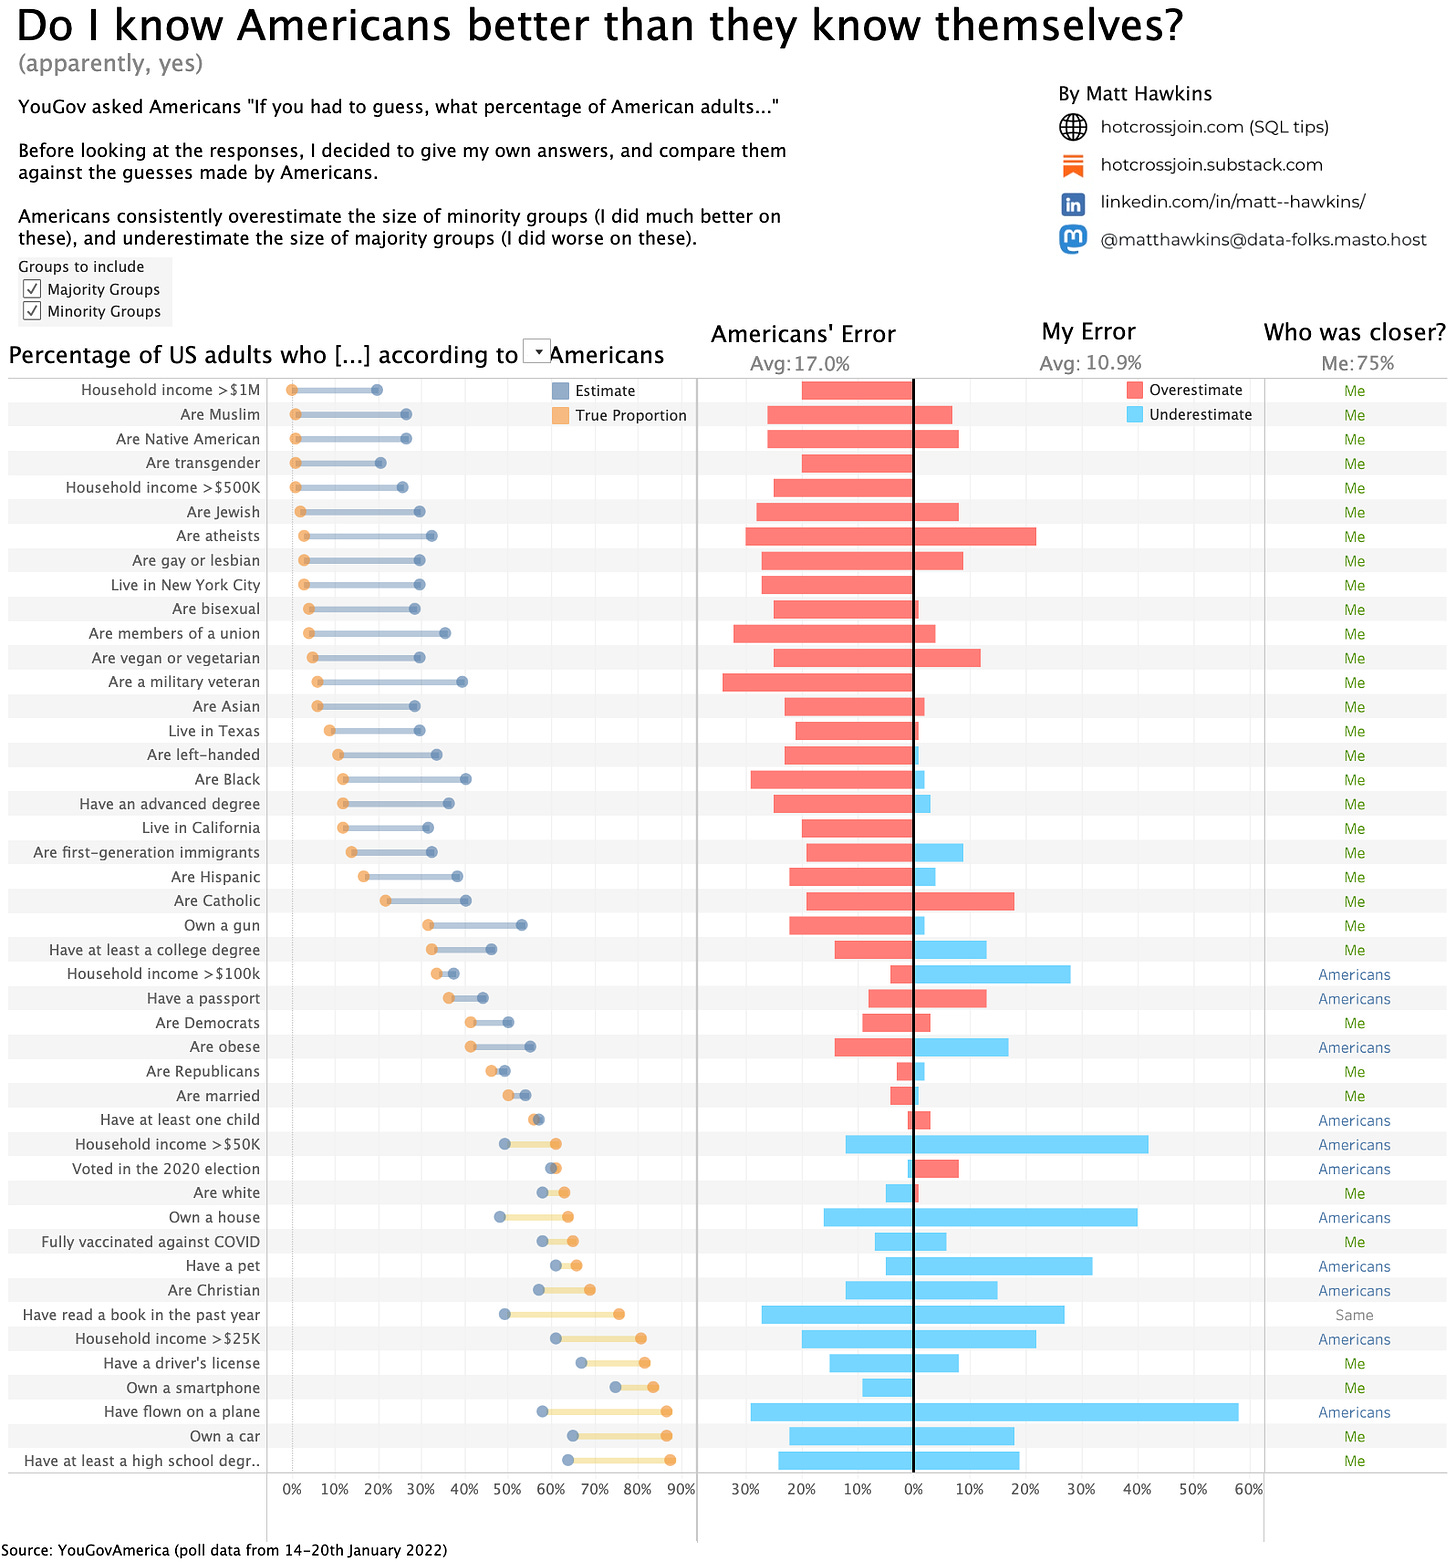
This morning, I looked at a Makeover Monday data set from a couple of weeks ago. The data set (which was originally published in March and reported in various places thereafter) contains the results of a poll, in which YouGov asked Americans “If you had to guess, what percentage of American adults…” followed by forty-five different endings to that sentence. The average responses are then compared against the true percentages of Americans falling into each group.
Rather than simply reproduce YouGov’s analysis, I decided to make my own estimates (before looking at the data) to see if I could do a better job than Americans of estimating what percentage of Americans fall into each category.
It turns out I could.
The image below is a static screenshot of the Tableau dashboard. You can find the interactive version here. It’s best viewed on desktop.
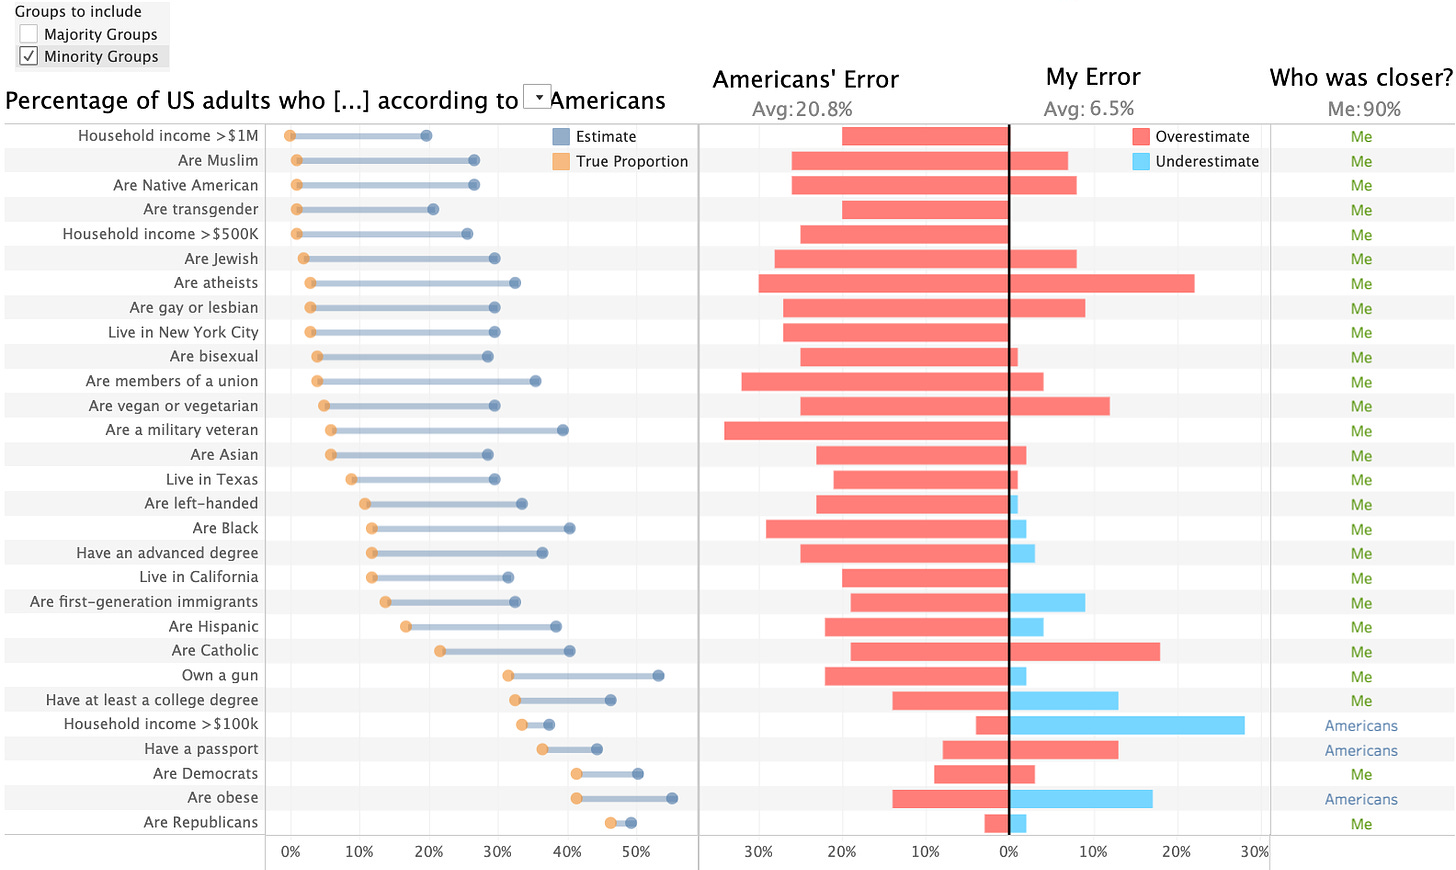
Americans consistently overestimate the size of minority groups, sometimes to a bizarre extent. For example, the average estimate of the percentage of Americans with an annual household income above $1M is 20% (the true rounded percentage is 0%). Likewise, according to Americans, 21% of their compatriots are transgender (the true rounded percentage is 1%). It’s hard to imagine where such numbers could have come from, especially given that these are averages and not maxima.
In a 2022 paper, Kardosh et al1 refer to this phenomenon as “minority salience” - the idea that we are “tuned toward spotting the uncommon and unexpected”, and consequently tend to see minority groups as being larger than they really are. This leads to a false impression of diversity, which the authors cite as leading to decreased support for pro-diversity policies.
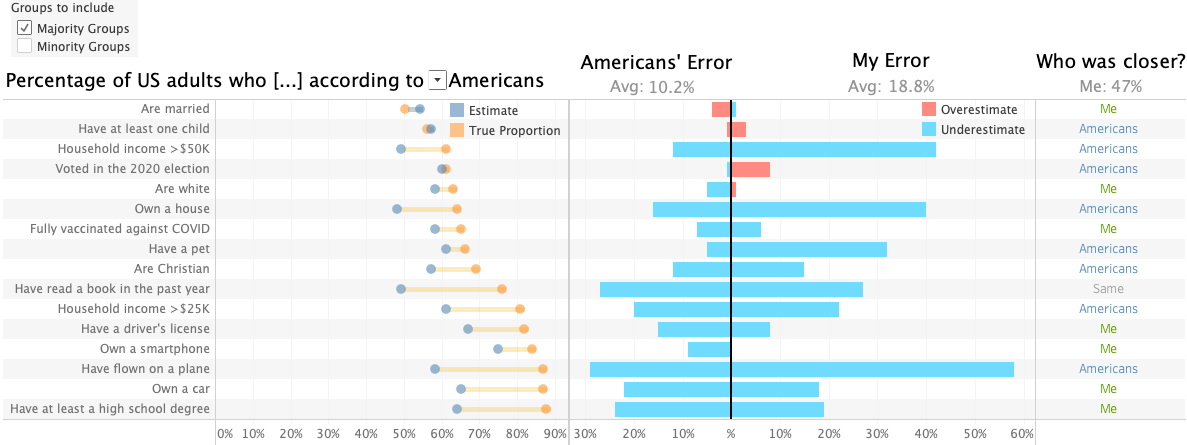
It’s unsurprising, by extension, that Americans also tend to underestimate the size of majority groups, albeit the differences with reality are generally less egregious.
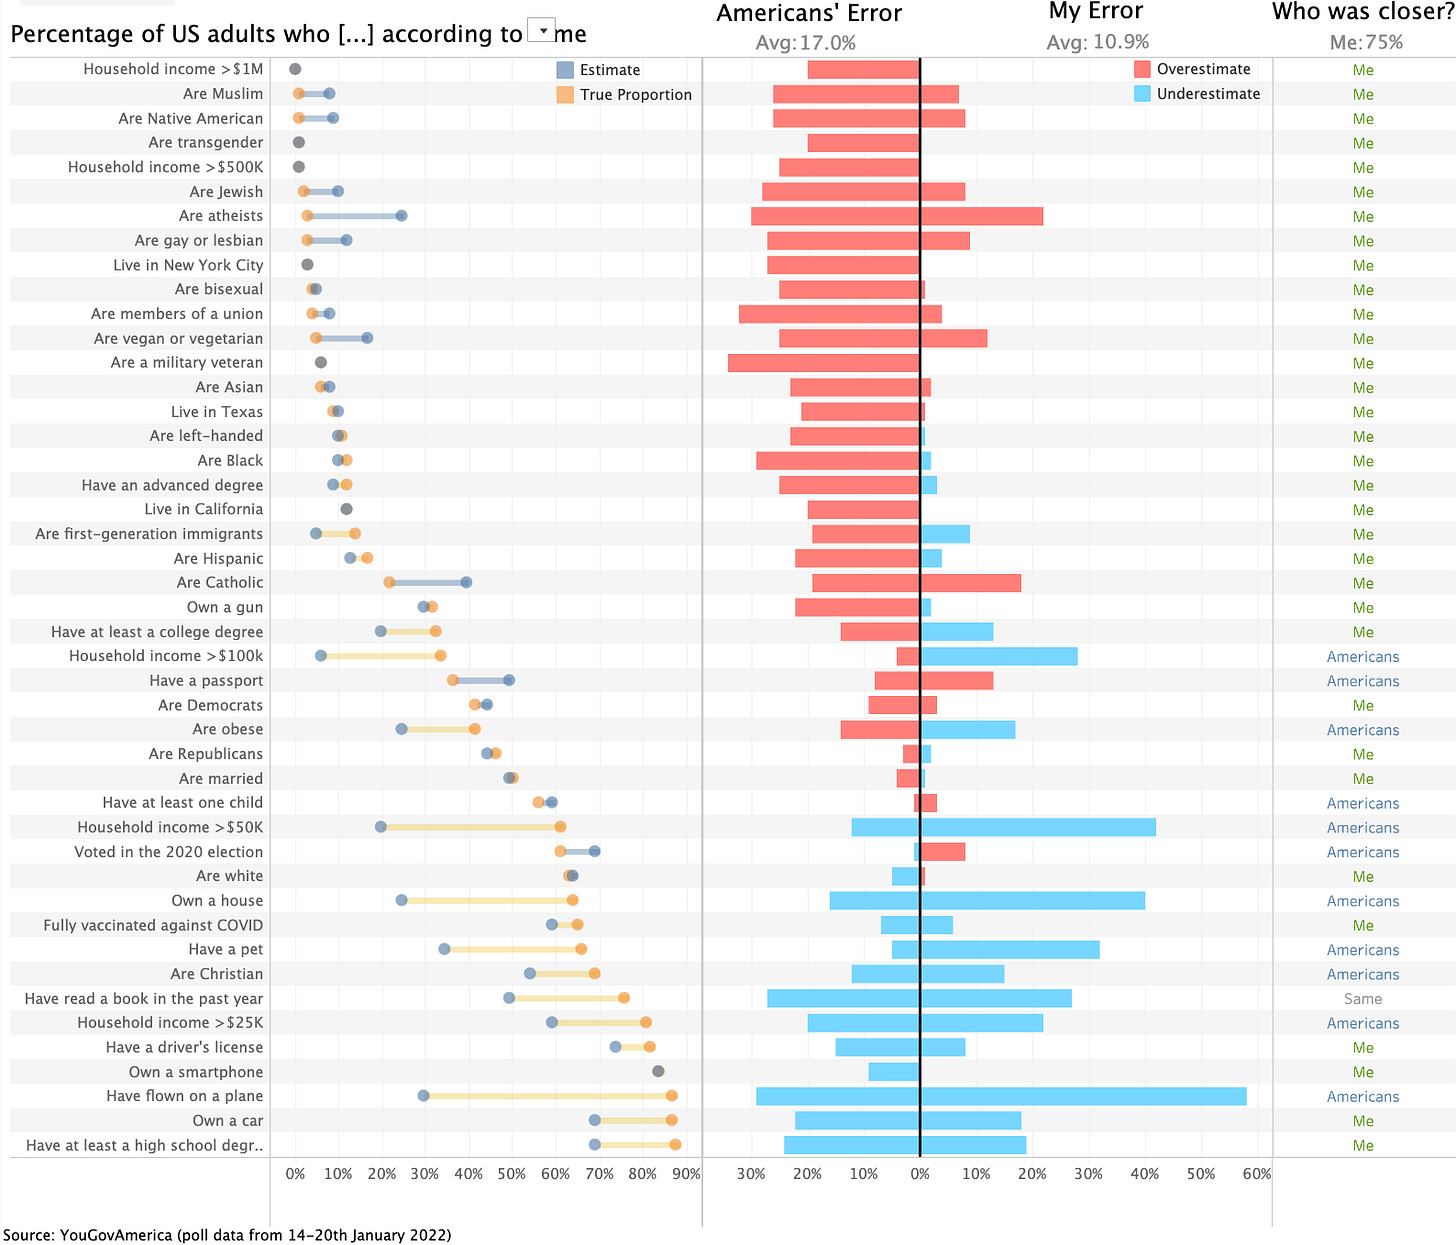
Now, if we click the toggle button above the left-hand chart, we can change it to compare my estimates against the true proportions.
Clearly, I’ve done a lot better than Americans at estimating the sizes of minority groups. For each of the twenty-four smallest groups, my estimates outperformed the average American’s estimate. Poll respondents’ estimates only outperformed my own across three of the twenty-nine minority groups.
For majority groups, it’s a different story. While Americans and I are alike in that we underestimate the size of most of these groups, American’s average error was 8.6 percentage points lower than mine. Apparently I have some misguided ideas about US homeownership (perhaps skewed by the fact that I live in London, where relatively few can afford to own a home), and wrongly assume that the USA is a nation of aviophobes.
For somebody who hasn’t been to the USA in thirty years, though, overall I’d say this went pretty well.
Rasha Kardosh, Asael Y. Sklar, Alon Goldstein, Ran R. Hassin, Minority salience and the overestimation of individuals from minority groups in perception and memory, PNAS (2022)


